Housing-related taxation receipts

In recent years, the summer period has become a boom time for those with an interest in the public finances. The past few weeks have seen a number of releases in the area including the Government’s Summer Economic Statement and IFAC’s Fiscal Assessment Report. The upcoming National Economic Dialogue will also spur debate in advance of Budget 2017.

With this in mind, readers might be interested in recent work published by myself and Kieran McQuinn (ESRI) in the Journal of European Real Estate Research examining the sustainable nature of housing related taxes in Ireland. Using a 3 pronged modelling approach we quantify the extent of housing related tax windfall gains and losses over a 30 year period as a result of disequilibrium in the housing market. We find that the fiscal position compatible with equilibrium in the housing market has at times diverged greatly from actual outturns both during the boom, the collapse and in the subsequent recovery.

The paper highlights the role played by the housing market in influencing the tax take and above all points to the need for a more granular approach to be taken in tax forecasting within Ireland. A link to the paper can be found here: http://www.emeraldinsight.com/doi/pdfplus/10.1108/JERER-01-2016-0004 with an older working paper version available here: http://www.esri.ie/publications/assessing-the-sustainable-nature-of-housing-related-taxation-receipts-the-case-of-ireland/.

Thinking about productivity

A recent OECD report “The Future of Productivity” (pdf) presents a new perspective on what drives national productivity growth. The OECD explains that in every world economy there are some ‘frontier firms’ which are internationally competitive and match global high standards in productivity. However, the majority of firms – up to 80 per cent – are not in this category. These firms may have a more domestic market orientation, and much lower average productivity and the OECD calls them ‘non-frontier firms’. The OECD illustrate the productivity gap between frontier firms and non-frontier firms over the last decade for OECD countries.  Productivity growth in frontier firms has been around 3.5-5.0% per annum compared to -0.1 to 0.5% per annum in non-frontier firms (see graph below).

Figure 11

Source: ‘The Future of Productivity’, OECD, 2015, Figure 11

The OECD explains that the ‘productivity slowdown is not so much a slowing of innovation by the world’s most globally advanced firms, but rather a slowing of the pace at which innovations spread through the economy: a breakdown of the diffusion machine … the gap between those high productivity firms and the rest has risen’.

What should policy-makers take from these findings? The frontier firms have a competitive advantage from their investments in knowledge-based capital, but also how they tacitly combine computerised information, innovative property and economic competencies in the production process. These firms are leaders in new-to-the-market innovations. But it is not only new-to-the-market innovation which matters for productivity. Policy-makers must focus on improving the take up of new innovations by the vast number of non-frontier firms which are more likely to find success with ‘me-too’ or ‘new-to-the-firm’ innovations. To maximise productivity gains we must aid the acceleration of the diffusion of innovations to non-frontier firms. The diffusion of innovations is good for growth, and the OECD argue that more effective diffusion may also promote inclusiveness. A recent study by Card et al. (2013) suggests that the observed rise in wage inequality appears to at least reflect the increasing dispersion in average wages paid across firms. Thus, raising the productivity of laggard (late adopter) firms could also contain increases in wage inequality, while reducing costs and improving the quality and variety of goods and services.

Progressing at Euro 2016

Before Euro 2016 started, John Eakins and I discussed the probability of qualification from the group stages of the tournament given the conditions of the four team round-robin structure. We had previously examined this for Euro 2012. Euro 2016 is more complicated as four of the six third place teams will qualify for the last sixteen. John proceeded to present all possible group outcomes (there are 729 in total) and the probability of qualification associated with each number of points. For example, nine points obviously results in 100% chance of qualification, while one point will see a country occupy 4th spot almost 90% of the time.

Given Ireland’s results to date, we now know the team can achieve a maximum of 4 points from Group E. Assuming (probably naively) Ireland beat Italy, and given the team’s head-to-head record with Belgium, it will be impossible for the Irish to finish ahead of the Red Devils if they manage at least a draw with Sweden. Should Sweden win, Ireland can only finish ahead of the Swedes if they can outscore Zlatan and co. by three goals or more. While the chance of a second place finish is still possible, it’s highly improbable. Scoring goals hasn’t been Ireland’s forte. Wales have now scored twice as many goals at Euro Finals (in the past ten days) than Ireland have (since 1988!).

Much depends on the outcome of the other group games. Group A is finished, with Albania sitting 3rd on three points. Ireland can better this and must hope another group ends with a third place team on 3 points or less. Had England beaten Slovakia, Ireland would now know that a win against Italy would be enough to progress.

Two more chances are presented tonight. A German victory over Northern Ireland or a draw in the Turkey Czech Republic game, will ensure four points guarantees a place in the last sixteen. Are either of these outcomes likely? The econometricians might be able to help us here. In early June Goldman Sachs published The Econometrician’s Take on Euro 2016. Exhibit 2 presents their model’s predicted results in each group game. Germany are predicted to win 2-1 against Northern Ireland tonight. The Turkey Czech Republic game is predicted to finish 1-1. Either will suffice for Ireland.

A word of caution. The model fails to predict a single clean sheet for any country in any group game. Past results shows that roughly one-third of games end with at least one team failing to score. So far, the model has predicted 9 correct match outcomes from the 28 games. Just 5 games have finished in the predicted score line.

It shouldn’t be overly concerning that Ireland’s game with Italy is forecast to finish 1-1. Let’s hope the econometricians are off the mark again.

Managing the Budget with High Debt and No Currency

A sovereign state with low debt can access liquidity through the markets. There are limits and they will be reached when the debt ratio begins to send out distress calls. Until that (unknown) point, there are, in effect, un-borrowed foreign exchange reserves. With an independent currency liquidity can be created for government or banks without external conditionality. There are limits here too and creating excess liquidity brings inflation risk and exchange rate pressure.
With high debt and hence uncertain access to bond markets a short-term expansion cannot safely be financed through debt sales without constraining capacity to repeat the procedure. Without a currency either, the creation of liquidity is conditional on the cooperation of the foreign central bank. If its conditions include constraints on fiscal action there can be no stabilisation policy – no exchange rate, no monetary or fiscal discretion.
Most Eurozone governments can borrow in the markets at low rates, courtesy of QE, despite historically high debt ratios. In the absence of QE the perception of capacity to borrow could diminish rapidly. Availability of QE is in any event not automatic – there is none for Greece, for example. There are also unclear conditions on ELA creation by national CBs. Consent from the ECB can be withdrawn arbitrarily or may be permitted only on penal conditions, such as pay-offs to unguaranteed creditors of bust banks.
The Eurozone governments with high debt face an illusion of policy space in current circumstances, with apparently easy access to debt markets. The constraint appears to be the EU rules about budgetary limits, as long as QE lasts.
But QE will end at some stage and the constraint becomes the market demand for sovereign debt. The design problem for fiscal policy (the only stabilisation tool available) is to manage the trade-off between using it now and having less to use later. Since the election Irish politicians have found agreement on two policies: (i) that the European Commission should be lobbied to relax the budget rules and (ii) that government should borrow ‘off balance sheet’.
Policy (i), lobbying the Commission, sacrifices future budget flexibility explicitly. The inverse demand curve for sovereign debt is r = f(D) where D is the debt ratio. Unless f(D) is flat the sacrifice is real. Moreover f(D) is unknown, although known not to be flat. Unless sovereign bond buyers are unable to count (ii), hiding sovereign liabilities, is just gaming the Eurostat debt definition. This definition (gross general government debt to gross output) is not a serious measure of debt servicing capability and, after QE, a sovereign could easily be inside some EU limit and unable to borrow. Eurostat does not lend money.
There are arguments for battling to borrow: interest costs are low and it is an article of faith that high-value public investment projects are plentiful. The trade-off (looser policy now versus the risk of ill-timed tightening later) would look better if the economy was becalmed, multipliers high, debt ratios modest, macro-volatility historically low and the foreign central bank known to be benign. None of these conditions applies currently in Ireland.
There is a case for using the QE respite to borrow reserves, accepting the negative carry, as NTMA appears to be doing. The case for deferring the attainment of budget balance is harder to see.

“No recovery here”

One of the really interesting outcomes of the last election was the rejection by voters of the Fine Gael strap line: let’s keep the recovery going. As measured by GDP growth, Ireland was rebounding from its period of austerity very strongly, with the fastest GDP growth in Europe.

A household sector which had just received an income tax cut, child benefit increases, pension increases, social welfare increases, public sector pay increases (or restorations, whatever), threw the main party’s ‘recovery’ line back in its face at the doorsteps–what recovery, they asked. No recovery here.

This was taken to mean that there was no recovery outside of Dublin. Dan O’Brien’s series of columns have dispelled that myth. There is a recovery in rural Ireland, it’s just not happening as quickly as in the capital, where employment levels are now 96% of their 2008 peak. In the Mid-West employment levels are at 88% of their peak.

Source: CSO.ie
Source: CSO.ie

Then a long and rambling discussion on the corporate tax element of Ireland’s apparent rebound took place, largely on twitter. The volatility of the corporate tax take in Ireland is exceptional.

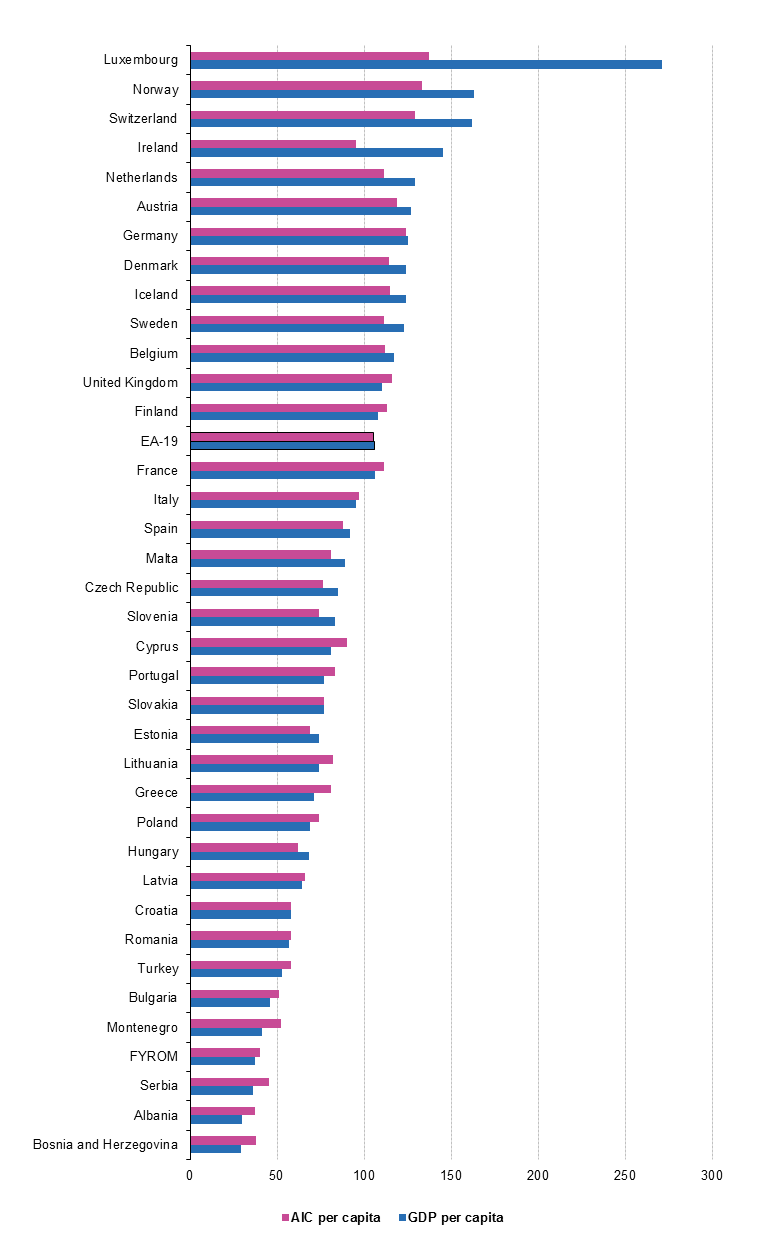
Yet another strand of the argument is given by thinking about Ireland in relation to Europe. Philip Connolly of the times in Ireland showed me these data of GDP per capita in purchasing power parity adjusted euros compare it with an actual income for consumption measure. The graph below is from Eurostat and shows the difference in the two measures  with Ireland and Luxemburg showing a very large difference between these two measures of household welfare. Using the AIC measure, Irish households are closer to Italian than Danish levels of welfare.

Source: Eurostat
Source: Eurostat

This may give a clue as to why we see such large differences between official rhetoric and the popular reaction to that rhetoric.