Regaining Competitiveness

The orthodox view is that enhanced competitiveness should play a significant part in Ireland’s (and other euro area countries’) recovery from recession.

In the March 2012 “Review Under the Extended Arrangement” the IMF team states that:

“Ireland’s economy has shown a capacity for export-led growth, aided by significant progress in unwinding past competitiveness losses.” (my italics)

The evidence does indeed point to a significant improvement in Ireland’s competitiveness between 2008 and the present.  The following two graphs show the ECB’s ‘Harmonized  Competitiveness Indicator’ (HCI) based on (a) Consumer Prices and (b) Unit Labour Costs.  (A rising index implies a loss of competitiveness.) Both graphs show a competitive gain since 2008, with second  showing the more dramatic improvement. However, this measure is affected by the changing composition of the labour force, which became smaller but more high-tech as a result of the collapse of many low-productivity sectors during the recession.

Concentrating on the HCI based on the CPI, the Irish competitive gain has still been impressive – our HCI fell 17% between mid-2008 and mid-2012, giving us the largest competitive gain recorded in any of the 17 euro-area countries over these years.  Greece, at the other extreme, recorded no change in its HCI, Portugal fell only 4.5%, Spain 6.6%, Italy 6.8%.  So by this measure Ireland is some PIIG(S)!

However, we need to dig deeper and understand why Ireland’s HCI has fallen so steeply.

Part of the story – the part on which some commentators dwell – is that early in the recession the Irish price level and Irish nominal wages fell. From a peak of 108 in 2008 the Irish Consumer Price Index fell to 100 in January 2010. But it has started to rise again – by mid-2012 it was back up to 105. The fall in the Harmonized Index of Consumer Prices has been even less impressive – from a peak of 110 to a low of 105 and now rising back to its previous peak.

Wages are more important than prices as an index of competitiveness because price indices are influenced by indirect taxes and include many non-traded services and administered prices. But Irish nominal wages tell much the same story as the price indices. The index of hourly earnings in manufacturing peaked around 106 at the end of 2009 (2008 = 100) and then fell to a low of 102 in 2011, where it appears to have stabilized.  Even in the construction sector, where employment collapsed in the wake of the building bust, wage rates declined only 6 per cent between 2008 and 2011.

Falling wages and prices are in line with what many commentators thought would happen after the surge in unemployment in 2008.  Widely-publicized wage cuts in the private and public sectors were seen as part of the ‘internal devaluation’ needed to rescue the Irish economy from the recession.  It was argued that this was the only way we could engineer a reduction in our real exchange rate given our commitment to the euro. (Paul Krugman likes to refer pejoratively to an ‘internal devaluation’ as simply ‘wage cuts’.)

However,  the Irish wage and price deflation has not been very dramatic and seems to have stalled in 2011, even though the unemployment rate continues to climb.

So why has Ireland’s competitiveness improved so sharply since 2008 if the ‘internal devaluation’ has been so modest?  The answer, of course, lies in the behaviour of the euro on world currency markets and the fact that non-euro area trade is much more important for  Ireland than for any other member of the EMU.

This can be seen by looking at the HCI for the euro area as a whole.  The euro area HCI fell from 100 in mid-2008 to 84.7 in mid-2012 – almost as big a fall as was recorded for Ireland and far higher than that recorded in any other euro area country.

The paradox that the euro area HCI has fallen much further than the average (however weighted) of the constituent EMU countries is explained by the fact that for each individual country the HCI is compiled using weights that reflect the structure of that country’s total international trade, but for the euro area as a whole the weights reflect the only the area’s trade with the non-euro world.

In its notes on the series the ECB draws attention to this:

“The purpose of harmonized competitiveness indicators (HCIs) is to provide consistent and comparable measures of euro area countries’ price and cost competitiveness that are also consistent with the real effective exchange rates (EERs) of the euro. The HCIs are constructed using the same methodology and data sources that are used for the euro EERs. While the HCI of a specific country takes into account both intra and extra-euro area trade, however, the euro EERs  are based on extra-euro area trade only.” (my italics)

It is understandable that Ireland should show a large competitive gain by euro area standards as the euro declined on world markets after 2008 because non-euro area trade is far more important to Ireland than to any of the other 16 members of the EMU. A fall in the dollar value of the euro does nothing to make France more competitive relative to Germany, or Greece relative to either of them, but it does a lot for Ireland relative to its two most important trading partners – the UK and the US.

As a consequence, the decline in the value of the euro on world currency markets, and especially relative to sterling and the dollar, has had a much larger effect on our competitiveness than on that of any other euro area country.

The following graph shows the USD / EUR exchange rate and Ireland’s HCI since 2008.  It does not take any econometrics to convince me that the main driving force behind Ireland’s competitive gain has been the weakness of the euro.  Undoubtedly a more sophisticated treatment, including the euro-sterling and other exchange rates of importance to Ireland – duly weighted – would show an even closer co-movement.

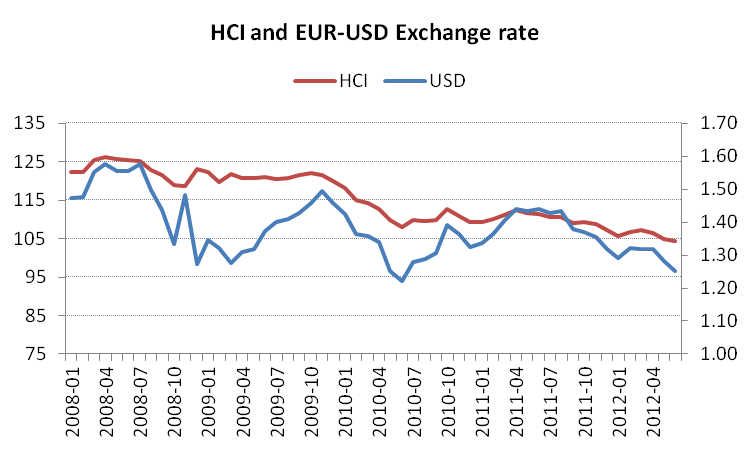
This should alert us to the point that Ireland’s much-praised recent competitive gain has been due more to the weakening of the euro on the world currency markets than to domestic wage and price discipline.

No doubt it could also be shown that a significant amount of the loss of competitiveness in the years before 2008 was due to the strength of the euro.

The fault – and the blame – lay not with us but with the far-from-optimal currency arrangement under which we labour.

Continuing gains in  competitiveness would therefore seem to depend more on further euro weakness than on the process of ‘internal devaluation’.  Should this have been a condition of our Agreement with the Troika?

Measuring Youth Unemployment

The problem of youth unemployment has rightly been highlighted as one of the major issues facing European countries today.  The newspapers have fastened on the shocking statistic that the unemployment rate among Spaniards and Greeks aged 15 – 25 is about 50 per cent, while the rate for the EU as a whole is about 20 per cent.  These are alarming numbers, but they are also somewhat misleading.

As Stephen Hill pointed out in a piece in the Financial Times on June 24th, the unemployment rate may not be the best measure of labour market conditions among young people who have opportunities to stay in the educational and training systems rather than entering a depressed labour market.  For this reason, an alternative measure, the unemployment ratio, has gained currency.

The conventional unemployment rate is  the numbers ‘unemployed’ as a proportion of the ‘labour force’.  The ‘labour force’ is the sum of the employed and unemployed.  The ‘unemployed’ are those actively seeking work, but not at work. (For young people it is of interest to break unemployment down into those ‘looking for first regular job’ and those who are ‘unemployed having lost or given up previous job’.)

The problem with using the  unemployment rate to measure labour market conditions among young people is that the denominator does not include those who are in the educational system or on full-time training courses.  During a recession, the higher the proportion of a youth cohort that stays on in school or college or in training, the smaller the labour force and the higher the unemployment rate. This is perverse.

By using the whole cohort as the denominator, the unemployment ratio avoids this pitfall and it may be argued that it therefore provides a clearer picture of hardship being caused by the lack of employment. (Of course this is subject to the reservation that increased educational participation may involve putting square pegs in round holes, with some young people taking courses in which they have no interest.)

The limitations of the unemployment rate as a measure of labour market conditions among the youth population is acknowledged by Eurostat, who now publish both the ratio and the rate for the population aged 15-24.  (Their recent figures for Ireland for 2011 are low and may not reflect the latest Census returns.)

The distinction between the unemployment rate and ratio certainly matters.  Data in the recently-released 2011 Census of Population volume This is Ireland Part 2 show the population classified by ‘principal economic status’. These reveal an unemployment rate of 38.7 per cent among the population aged 15-24 compared with an unemployment ratio of 14.2 per cent. While the ratio of 14.2 per cent gives no grounds for complacency, it is less alarming than the headline rate of almost 40 per cent.

It is perhaps even more important to note that the unemployment ratio has not risen as dramatically as the unemployment rate since the onset of the recession in 2008. The Figure displays the three concepts based on the 2006 and 2011 Census data.

(The Table at the end provides more details.)

Whereas the unemployment rate rose by 140% the ratio rose by 90%.  Thus, the rate tends to overstate both the level of unemployment among young people and the rate at which it has risen.

It may, however, be objected that the unemployment ratio includes all those who are not in the labour force in the denominator but excludes discouraged workers and similar forms of disguised unemployment from the numerator.  This bias would certainly be significant among older workers, who are more likely to cease looking for work and to drop out of the labour force because no jobs are available.  Its effect on the youth data, however, is smaller because labour force categories other than ‘employed’, ‘student, and ‘unemployed’ are relatively unimportant among the young.  In 2011 less than 2 per cent of population aged 15- 24 are classified as ‘looking after home/family’!

None the less, to take account of ‘dsicouraged workers’ it is worth looking at another concept that has gained some currency .  This is the NEET ratio. It refers to the proportion of the population that is Not in Employment, Education or Training.  To calculate this ratio for Ireland I have assumed that those in ‘(full-time) training’ are classified as ‘students’ in the Census.  The resulting ratio must, by definition, fall between the unemployment ratio and the unemployment rate.  From the Figure we can see that it lies closer to the unemployment ratio. Moreover, it has risen less rapidly than either the unemployment rate or ratio.   In 2011 the NEET ratio was ‘only’ 65 per cent above it 2006 level.

It is striking that the widely-used unemployment rate is so much higher, and has risen so much more, than the alternative – and arguably better – measures of the situation in the youth labour market.

The reason why the unemployment rate overstates both the level and rise in Irish youth unemployment is the high level of educational participation and its marked increase over the past five years. The proportion of the 15-24 year-old population in the educational system rose from 50.1 per cent in 2006 to 60.5 per cent in 2011.  While not all of the additional years of schooling will be as productive as we would wish, being in the educational system is less wasteful than being unemployed.  This aspect of the adjustment to the present crisis is concealed by the conventional youth unemployment rate.

None the less, we cannot lose sight of the collapse of employment among the youth population.  In 2006 39.5 per cent of the population aged 15-24 was in employment.  By 2011 this percentage had fallen to 22.5.  Among those aged 20-24 the rate declined from 60.0 to 39.0.  While the youth unemployment crisis may not be as severe as suggested by the headline youth unemployment rate, it is a crisis.

Labour Costs

The question of achieving an ‘internal devaluation’ has been raised in a late contribution to the previous thread.  It deserves more attention than it tends to receive on this site.

The phrase refers to improving competitiveness in the absence of a national exchange rate by reducing costs and prices relative to those of competitor countries.

Labour costs are a major component of domestic costs and one over which we retain ‘sovereignty’.

In March Eurostat published some relevant data on hourly wage costs. (Today’s Irish Independent carries a summary of the report.)

In 2011 Irish hourly labour costs were €27.4, which was 99.3 per cent of the Eurozone (EZ) average of €27.6.  In 2008 (the peak year) Irish labour costs were 105.7 of the EZ average, so there has been some improvement in this measure of our competitiveness.

However, Irish costs remain much higher than those in several EZ countries.  Here are some relevant comparisons: Spain €20.6, Slovenia €14.4, Portugal €12.1 and Estonia €8.1.  Outside the EZ the UK figure is €20.1, while the US Bureau of Labor Statistics gives a figure of $34.2 for hourly labour costs in US manufacturing in 2010 compared with $36.3 for Ireland.

Obviously all EZ countries cannot gain competitiveness relative to each other by reducing labour costs, although the EZ as a whole could become more cost-competitive relative to the rest of world by this strategy.   However, I think it is clear that we would have to wait a long time to see any dramatic results from this source either in Ireland or in the EZ as a whole.

‘Tis the Season to be ….

… happy!

So I thought I would share my thoughts on how the Irish are faring on this front.

The Future of the Euro

On the afternoon that marks the beginning of the end of the Berlusconi era in Italy,  Gideon Rachman’s piece in today’s FT seems no more than an acknowledgement of the realities now facing us.