This headline appeared in the Irish Times on 20th December 2010. In the article that followed Frank McDonald admitted this was “paradoxical” but explained that recent research has linked severe winters in northern Europe to diminishing levels of ice in the Arctic sea. A more detailed account of the same reasoning is contained in this article published in the New York Times on December 26th 2010.
This new view of the effects of global warming is quite an about-turn.
In 2009 the Irish Environmental Protection Agency (EPA) published a Summary of the State of Knowledge on Climate Change Impacts for Ireland. This document provides predictions for key climatic variables for the rest of 21st century based on extrapolations of observed changes relative to the 1961-1991 averages. Here is how some key trends are summarized in Tables 2.1, 2.2, and 2.7.
“All seasons are warmer but more so in winter”
“Less frost; trend of decreasing frost nights and decrease in duration.”
“Less (sic) snow days”.
“Increases in Irish coastal water temperatures”.
“Drier summers”
All but the last of these generalizations were made with a “high degree of scientific confidence”. The deluges of the summers of 2007, 2008, and 2009 reduced the confidence attached to the last point to “medium”.
If instead of the the recent extreme weather events there had been comparable deviations in the other direction (dry, hot summers and mild, snow-less winters) confirmation bias would have led many commentators to view such events as strong support for the predictions contained in the EPA document. The same bias now leads commentators to label the actual recent pattern of extreme events “anomalies” and to offer ad hoc explanations for them. One has to wonder about a science that flip-flops from predicting one extreme to the other in so short a space of time. If climatologists are now saying that our winters may be going to get colder rather than warmer, it will be very hard to test the various hypotheses associated with the idea of “global” warming.
A longer term perspective is needed if we are to talk about “climate” as opposed to “weather”. In an earlier post I drew attention to absence of a positive trend in the Dublin’s annual average temperature over the period 1958 to 2008. Two more years of data have reinforced the main points I made in that contribution. In 2009 Dublin’s temperature was slightly below the long-term average, while 2010 was the coldest of the past 52 years, with an average temperature of 8.3º C – more than two standard deviations below the 1961-1991 average used by meteorologists to represent “the long run”. During last winter (December 2009 – February 2010) the average temperature was three standard deviations below the long-run winter average. It is very likely the winter of December 2010 – February 2011 will also be unusually cold.
However, it would be a mistake to believe that the recent downward trend in annual temperatures is due only to colder winters. June and July were the only months of 2010 when Dublin temperatures were above their long-run averages. The warmest year of the past half century was in 1989. The average temperature during the naughties was lower than during the 1990s
A longer term perspective is needed if we are to talk about “climate” as opposed to “weather”. The graph of Dublin’s annual average temperatures (below) does not convey an impression of a consistent upward trend in annual temperature since 1958. This is confirmed by standard statistical tests, which reveal that there has not been a significant trend (positive or negative) in the annual data over the entire 52-year period. Nor has there been a consistent trend in temperature in any of the four seasons. More detailed investigation shows that there was a significant positive trend for some 30-year windows between 1958 and 1993, but for all such windows between 1971 and 2010 the trend has been negative although not statistically significant. The trend in Winter and Summer temperatures has been negative but not significant since the 1970s. Similar graphs of Dublin’s rainfall reveal no significant trends.
The fairest summary of this evidence would seem to be that Dublin’s climate has not changed significantly over the past half century. 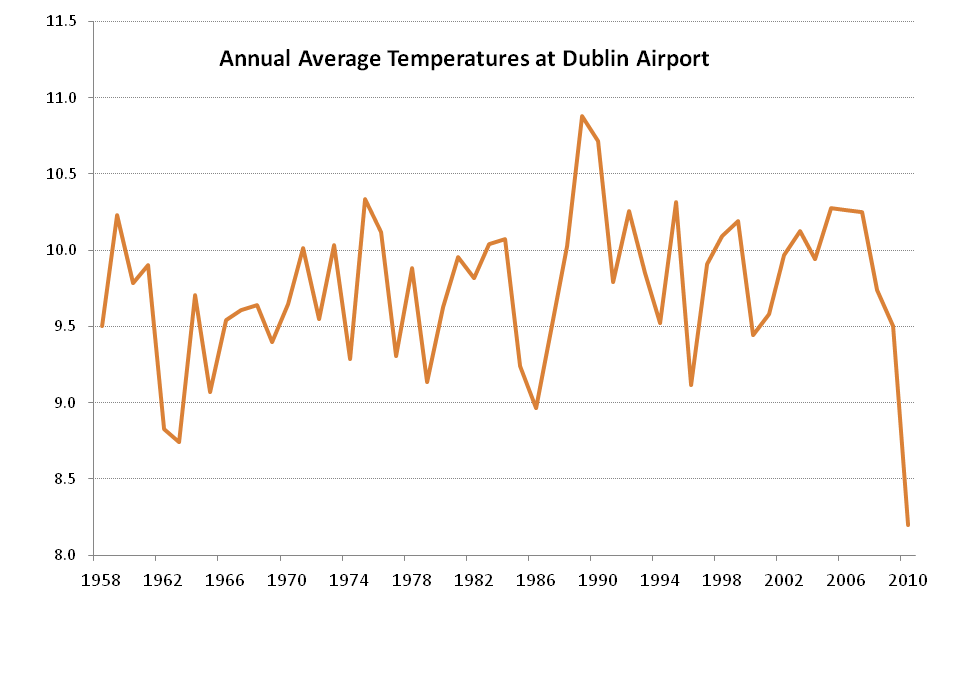
The evidence for an upward trend in temperatures over the past half century is stronger for weather stations outside Dublin. Dublin has become colder than other parts of Ireland. Belmullet, for example, shows strong evidence of a positive temperature trend for much of the period and the Dublin minus Belmullet differential widened markedly in the 1990s. But here, too, there is a puzzle: Belmullet’s temperature showed no positive trend between 1958 and the mid-1980s but for the next twenty years there was a strong positive trend, while the last three years have been cooling again. Here, as for the other stations, the volatility of the data is very striking.
These small pieces of evidence may, of course, be dismissed as irrelevant to the “global warming” debate. But to adapt Tip O’Neill’s aphorism, all climate is local. The Dublin data draw attention to the fragility of some of the evidence on which recent predictions of climate change have been based.
Happy New Year!
